When Your Dashboards Are Healthy and Your Users Are Not: Closing the Observability Gap
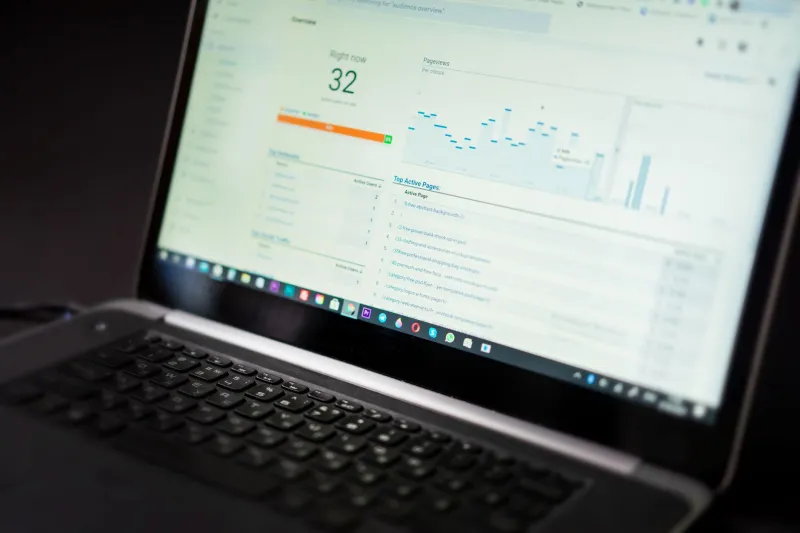
The observability stack at a mid-sized SaaS company looks, on paper, like a model of engineering discipline. Distributed traces span every service boundary. Structured logs flow into a centralized platform. Custom metrics track queue depths, cache hit ratios, and database connection pool utilization. P99 latency charts are green. Error rate dashboards are green. The on-call engineer finishes their shift without a single page.
The support team, meanwhile, has fielded fourteen tickets in the past six hours from users reporting that checkout is broken.
This is not a hypothetical. Variants of this scenario occur regularly in organizations that have invested heavily in telemetry infrastructure without equally investing in the question of what that telemetry is actually measuring. The result is a form of observability that is technically sophisticated and operationally misleading — a system that tells compelling stories about itself while the user experience degrades silently.
The Instrumentation Blind Spot
Tracing and metrics are inherently inside-out perspectives. They measure what the system believes it is doing: how long a function call took, whether a database query returned a result, what the CPU utilization of a container was at a given moment. These measurements are accurate within their scope.
The problem is that scope. A trace that shows a checkout request completing in 180 milliseconds is reporting the time elapsed inside the application boundary. It is not reporting the time the user waited for the page to respond. It is not accounting for the DNS resolution that took 400 milliseconds because of a misconfigured resolver. It is not capturing the JavaScript bundle that blocked rendering for two seconds on a mid-tier mobile device. It is not reflecting the three retries the mobile client silently attempted before the successful response.
From the application's perspective, the request was fast and successful. From the user's perspective, checkout took nearly three seconds and felt unreliable. Both observations are accurate. Only one of them appears on the dashboard.
How Sophisticated Tooling Amplifies the Problem
Counter-intuitively, the sophistication of modern observability platforms can deepen rather than resolve this gap. When an engineering team has access to high-cardinality trace data, flame graphs, and service dependency maps, there is a strong pull toward optimizing what is visible. Traces get annotated. Slow spans get investigated. Instrumentation coverage expands.
Each of these activities is valuable in isolation. Collectively, they create an organizational dynamic where observability investment concentrates on the interior of the system — where data is abundant and tooling is mature — rather than at the boundary where the user actually encounters the product.
This dynamic is reinforced by how observability work is evaluated. Reducing a traced endpoint's P99 latency from 350 milliseconds to 210 milliseconds is legible, measurable, and reportable. Investigating why a subset of users on specific carrier networks experience intermittent timeouts requires synthetic monitoring, real user measurement data, and a willingness to pursue signals that do not originate inside the application perimeter. The former produces a satisfying metric improvement. The latter requires more ambiguous work.
The Telemetry That Actually Reflects User Experience
Aligning observability investment with user impact requires deliberately expanding the measurement surface to include signals that originate outside the application boundary.
Real User Monitoring (RUM) captures timing data from actual user sessions in the browser or native client. Unlike synthetic checks, RUM reflects the full range of network conditions, device capabilities, and geographic distribution that real users bring to the product. Core Web Vitals — Largest Contentful Paint, Cumulative Layout Shift, Interaction to Next Paint — provide a standardized vocabulary for quantifying experience degradation that product and engineering teams can share.
Synthetic monitoring from geographically distributed probes fills the gap between RUM data points by providing continuous, controlled measurement from fixed vantage points. When a CDN edge node in a particular region begins serving stale content, synthetic monitoring from that region will surface the problem before enough real users encounter it to generate ticket volume.
Client-side error tracking captures failures that the server never observes: JavaScript exceptions, failed resource loads, network timeouts that the client handles with a retry. These events are invisible to server-side traces but are directly experienced by users.
Session-level outcome tracking connects technical events to business outcomes. A checkout session that ends without a conversion is a signal. Whether that session also contained elevated API latency, client-side errors, or specific network conditions is a question that requires joining telemetry data across layers — but the answer is often more actionable than any single metric in isolation.
Rethinking What Healthy Means
The concept of system health in most engineering organizations is defined by infrastructure metrics: service availability, error rates, latency percentiles. These are useful leading indicators of user impact, but they are not substitutes for it.
A more useful definition of health asks: what percentage of users attempting to complete a meaningful action in the product are succeeding, and how long does it take them? This framing, sometimes called outcome-based monitoring, is harder to instrument than infrastructure metrics but considerably more honest about what the system is actually delivering.
Some teams operationalize this through funnel monitoring: tracking completion rates for critical user journeys — account creation, first purchase, document upload — and alerting when completion rates drop below expected thresholds. A drop in checkout completion is a health signal regardless of whether any individual service metric has moved. It surfaces the user experience impact directly, without requiring an engineer to infer that impact from internal telemetry.
The Alert That Nobody Sends
One of the more revealing questions an engineering organization can ask itself is: how do we currently find out that users are having a bad experience? If the most common answer involves support tickets, social media, or a sales team relaying customer complaints, the observability investment has not closed the gap that matters most.
The goal is not to eliminate those channels — user feedback is valuable and irreplaceable. The goal is to ensure that the engineering team learns about user experience degradation before it accumulates enough volume to generate external reports. That requires monitoring that is anchored to user outcomes, not just to system internals.
Calibrating Investment Toward Impact
None of this argues against investing in distributed tracing, structured logging, or infrastructure metrics. These capabilities are foundational and genuinely useful for diagnosing the root causes of problems once they are identified. The argument is for calibrating the balance of observability investment toward the layer where users actually encounter the product.
A practical rebalancing starts with a straightforward audit: for the last five production incidents that generated user complaints, how many were first detected by internal telemetry versus external reports? The ratio is an honest measure of how well the current observability posture is serving its primary purpose.
For most organizations, that ratio is less flattering than the dashboard suggests.