Monitoring Yourself Into Bankruptcy: The Hidden Economics of Observability at Scale
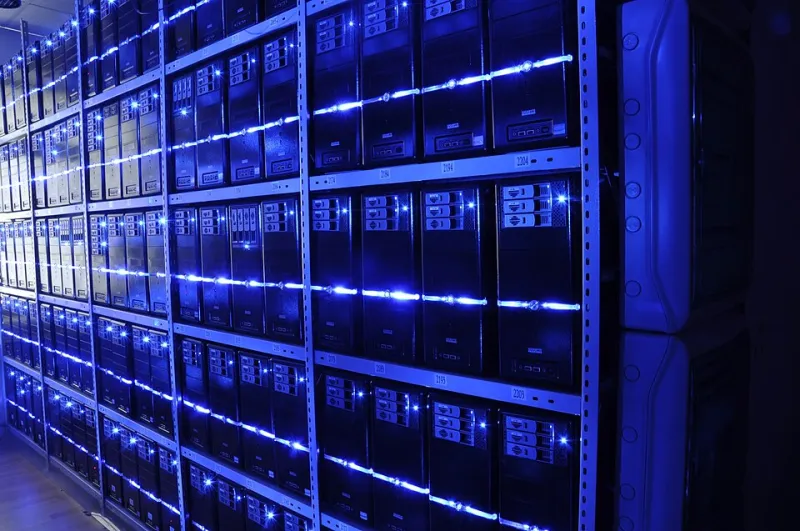
Photo: BalticServers.com, CC BY-SA 3.0, via Wikimedia Commons
There is a particular kind of budget conversation that engineering leaders dread. It is not the one about headcount or cloud compute — those numbers are at least predictable. The conversation nobody wants to have is the one where someone pulls up the observability invoice and the room goes quiet. For a growing number of US technology organizations, the cost of watching their systems has begun to rival the cost of running them.
Observability was supposed to be the answer to operational blind spots. And in principle, it still is. But somewhere between the promise of full-stack visibility and the reality of production systems generating terabytes of telemetry daily, the economics quietly inverted. Teams are now paying premium rates to store data they never query, instrument paths that never fail, and maintain overlapping toolchains that were each justified by a different incident two years ago.
Understanding how this happens — and more importantly, how to stop it — requires an honest look at the architectural decisions that accumulate into an observability tax.
How Logging Pipelines Become Cost Sinkholes
Most observability debt does not originate from a single bad decision. It accumulates through a series of individually defensible choices that compound over time. A developer adds verbose debug logging to trace an intermittent issue. The fix ships, but the logging stays. Another team adopts a distributed tracing library with generous default sampling rates. A third team duplicates metrics to a secondary platform because the primary one had an outage six months ago.
None of these decisions are unreasonable in isolation. Together, they create a system where data volume grows faster than the engineering value extracted from it. The unit economics of observability depend on a ratio that rarely gets measured: insight generated per gigabyte ingested. When that ratio degrades, the organization is essentially paying increasingly higher prices for diminishing returns.
The challenge is that most logging and metrics platforms charge on ingestion or retention volume, not on the value of the queries you run. That pricing model creates a structural incentive to send everything and figure out relevance later — a strategy that works until the invoice arrives.
The Vendor Lock-In Multiplier
Cost pressure in observability is rarely just a volume problem. It is frequently a vendor problem. Many teams made platform commitments during periods of rapid growth when engineering velocity mattered more than unit economics. Those commitments now carry hidden switching costs that make renegotiation difficult and migration even harder.
Proprietary query languages, custom agent instrumentation, and platform-specific data formats all function as soft lock-in mechanisms. When a vendor raises prices — and in a consolidated market, they do — the practical alternatives shrink considerably. Teams that built their alerting logic, dashboards, and on-call workflows around a single platform find themselves negotiating from a position of weakness.
A cost-conscious observability architecture anticipates this dynamic. The OpenTelemetry standard has matured substantially over the past several years, offering a vendor-neutral instrumentation layer that separates data collection from data storage and analysis. Teams that instrument against open standards retain the ability to route telemetry to different backends as the market evolves, which is a meaningful form of architectural leverage.
Redundant Instrumentation: Paying Twice for the Same Signal
One of the more expensive patterns in observability is instrumentation redundancy — situations where the same operational signal is being captured, transmitted, and stored through multiple independent pathways. This happens most often in organizations where platform ownership is fragmented across teams.
A common scenario involves infrastructure metrics being collected at the host level by one agent, at the container orchestration layer by a second agent, and at the application level by a third SDK — all feeding into separate storage backends. The resulting data is not complementary; it is largely overlapping. Each layer captures CPU utilization, memory consumption, and network throughput through slightly different lenses, but the marginal value of the third dataset rarely justifies its cost.
Auditing instrumentation coverage is an unglamorous exercise, but it consistently surfaces significant savings. The goal is not to reduce visibility — it is to eliminate the cost of visibility that was never being used to make decisions.
Building a Framework for Cost-Conscious Observability
The path forward is not to instrument less. It is to instrument with intention. That distinction matters because the reflexive response to high observability costs — cutting logging budgets or reducing retention windows — often creates operational risk without delivering proportional savings. The goal is to align instrumentation investment with operational value, not to minimize it arbitrarily.
A practical framework starts with signal classification. Not all telemetry is equal. Logs, metrics, and traces each serve different diagnostic purposes, and each carries different cost characteristics. High-cardinality trace data is expensive to store and query. Aggregated metrics are comparatively cheap. Structured logs fall somewhere in between. A tiered retention policy that reflects these cost differences — keeping granular traces for 72 hours while retaining aggregated metrics for 13 months — can dramatically reduce storage costs without compromising the ability to investigate historical trends.
Sampling strategy deserves more deliberate attention than most teams give it. Head-based sampling, where the decision to trace a request is made at ingestion, is simple but imprecise. Tail-based sampling, where traces are retained or discarded based on whether they contain errors or anomalies, is more complex but far more cost-efficient. For high-throughput services, the difference between a 10% head-based sample and an intelligent tail-based sample can represent orders of magnitude in storage cost.
Finally, observability governance — the organizational practice of reviewing instrumentation coverage, data volume trends, and platform costs on a regular cadence — should be treated as an engineering discipline rather than a finance exercise. When engineering leaders own the economics of their observability stack alongside its technical performance, the incentives align in ways that prevent the slow accumulation of waste.
The Business Case for Observability Architecture
For US technology organizations operating in a tighter capital environment, the argument for investing in observability architecture reform is straightforward. Observability costs that grow faster than the business are a form of technical debt with a monthly interest payment. Unlike code quality debt, which manifests gradually through slower development cycles, observability debt shows up on the invoice every thirty days.
The teams that get this right are not the ones that spend the least on monitoring. They are the ones that extract the most operational clarity per dollar spent. That is a different optimization target, and it requires architectural thinking rather than budget cutting.
At B8A Tech, we work with engineering organizations that are building systems designed to scale efficiently — in performance, in reliability, and in cost. Observability is not a tax on running software. It is an investment in understanding it. The difference between those two framings is the difference between reactive cost management and deliberate engineering leadership.